


The Joint Monitoring System developed for the sustainable management of water resources in the cross-border area, aims at optimal management of water demand, by undertaking the storage, management, visualisation and analysis of consumption in order to provide predictions for its characteristics, the detection of exceptional problems, the information to consumers, as well as the information to the executives of the water company.
In summary, the Joint Monitoring System offers the following features:
- Secure Internet access and remote operation to scalable cloud computing infrastructures;
- Storage, management and processing of measurement time series in their primary form together with additional data relating to network characteristics (historical consumption data, measurement/control points, limits, meteorological conditions);
- Generation of interactive reports and indicators for predicting network characteristics at time and spatial intervals defined by the user taking into account all available information;
- Visualisation on graphs and interactive maps of measurement and output indicators/provisions data, as well as selective Internet availability to external users.
The monitoring system is characterised by the adoption of modern technologies and operating principles in order to ensure the low cost and intrinsically escalable provision of its services, the servicing of the existing and potential future needs, as well as the avoidance of inclusion in specific closed technologies and standards. In particular:
- The system is offered as a service (Software as a Service) and its services are exclusively online, without requiring the installation of any other software or libraries by its users (consumers, users, third systems).Users can be accessed through simple page spreaders, while the collection and supply of data and services to other systems is done through open online services;
- The whole application is located in cloud-based infrastructure, which intrinsically scales according to demand, reducing operating costs and ensuring maximum flexibility for the expansion and wider use of the system in the future. In addition, the cost of supply, maintenance and management of both the necessary hardware and software is avoided, effectively zeroing the operations related to the management and continuous operation of the system. This option is now a rule for modern information systems in both the private and public sectors;
- The architecture of the system as well as the individual technologies presented in the following sections have been selected in order to optimally satisfy all the needs of scaling, services and operation, and incorporate distributed data processing and machine learning technologies to enable the participation of equivalent architectures that encapsulate the system as a service.
Final Consumers have access to the application and to a subset of services that present only the elements of their consumption, as well as other useful services. The application also offers flexible statistics on water consumption in a graphical way, allowing the user to choose the desired time period and optionally to consume other user groups and/or time periods. In this way, the user will have access to detailed information about their consumption and will be able to explore its evolution, predicted water use, as well as the behaviour of other grouped users.
Moreover, the application includes a section with informational messages generated for the user. In particular, it offers personalised alerts generated automatically by the analysis system taking into account historical user consumption data (e.g., possible leakage, unusual change in consumption). The system offers electronic payment of a paper account with
(a) providing a unique identifier from the system and importing it into web banking of a partner banking organisation or
(b) incorporating an electronic payment module. Finally, the system automatically and periodically produces consumption reports in pdf format, available for viewing and downloading.
Water Companies have secure access to the application via its browser and receive direct executive information on the application’s home page for the data it selects (e.g. indicators, interactive graphs). They can also create charts for analysing water consumption by selecting different variables. In this way, it is possible to create practically all kinds of graphical analysis in a flexible way that responds to the regular and exceptional business needs of users and they can make comparisons for the same or different reference time period.
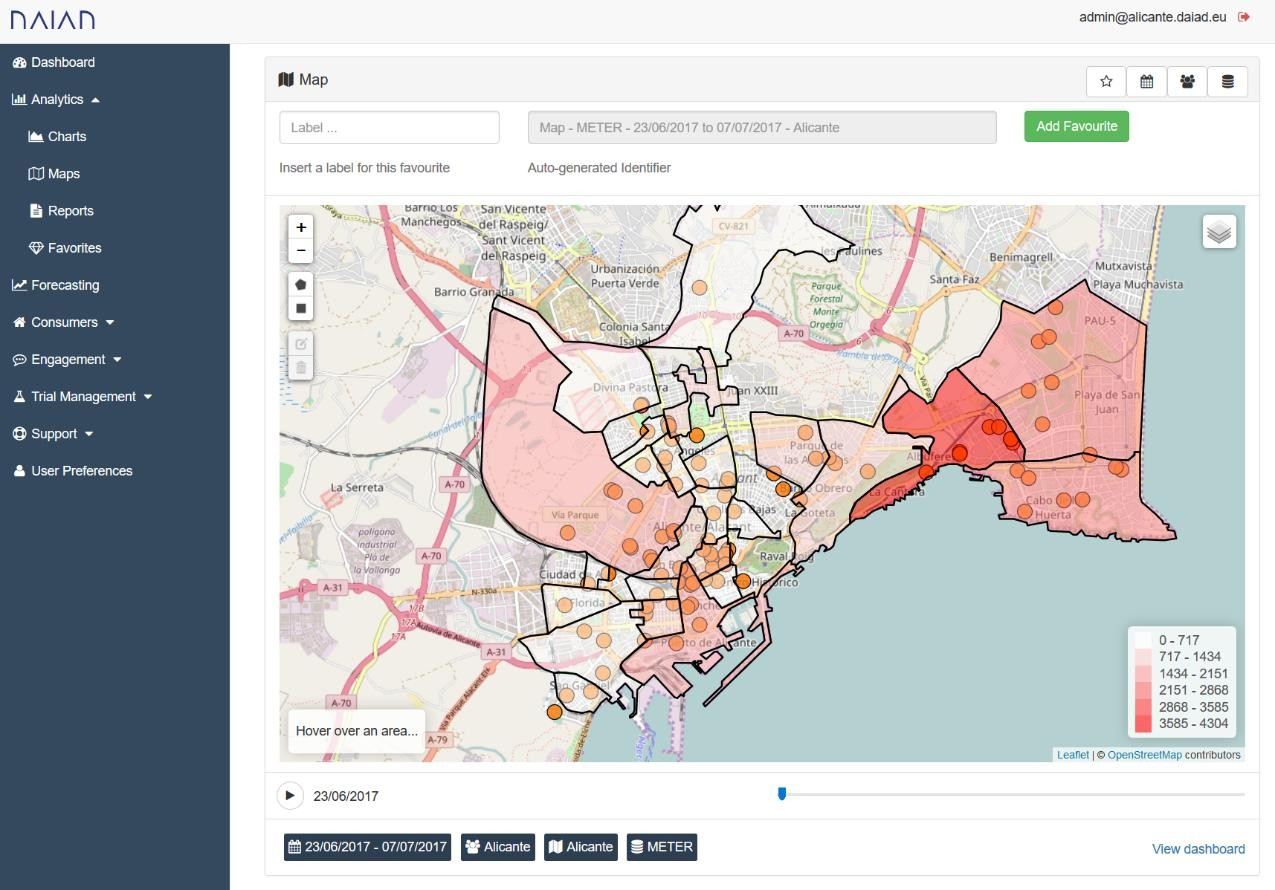
Users of water companies can create interactive maps and digital backgrounds with the consumption data. The system also offers a consumer prediction of consumption service, allowing the user to select
(a) the amount of time they are interested in and
(b) the user groups of interest. Last, the system is able to automatically perform a set of basic data analysis algorithms. The basic automated services include:
- Establishment of consumers (clustering) based on demographic data;
- Consumer clustering based on their consumption;
- Aggregation of consumption time series on a daily, monthly and annual basis;
- Consumer classification based on their consumption;
- Consumer consumption forecast;
- Calculation of potential maximum consumption savings per consumer.
Attachments:
|
JOINT MONITORING SYSTEM FOR SUSTAINABLE WATER MANAGEMENT - Newsletter 3
Popular 772.43 KB |
25/05/2022 09:09:35 |
|
Agenda local event Alexandroupoli 22.03.2022 - Greek Version
Popular 1.17 MB |
25/05/2022 09:20:32 |
|
Invitation local event Alexandroupoli 22.03.2022 - Greek version
Popular 496.62 KB |
25/05/2022 09:19:01 |

